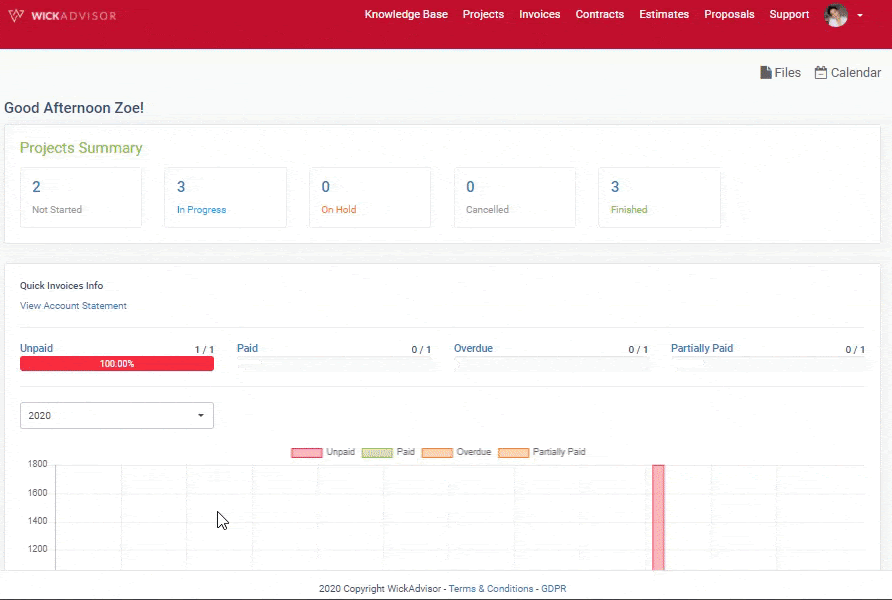
After we kickstarted your project, the progress can be tracked via the Project Dashboard.
To login visit https://dash.wickadvisor.com/
Regarding the login guide, check the following link for further information: How to Login to WickAdvisor Dashboard
Gantt Chart provides a quick overview of your project activity. It provides a quick visual display of the individual start and end date of the tasks to give you a clearer idea on the flow of your project.
Through the Gantt chart, you can see the task schedule in the project in a structured manner and clearly describe the timeline of your project.
The steps you can follow to view the Gantt chart:
- Click ‘project’ feature on the top of dashboard
- In case you want to see the project timeline with a specific status, click the project you are aiming for
- Click 'gantt chart'
- You can change the appearance of the gantt chart in daily / weekly / monthly, or yearly by clicking the button to the right of the dashboard. Weekly view are recommended for you for better explanation